I’ll admit – I still try and write Python like it was C or C++. To fix that for a while I am going to switch to writing things in Python for a while, while working on actually writing good Python.
Graph algorithms are the kidneys of computer science – there in the background filtering out all the bad things for us. In my switch over to writing in Python I needed to find a solid python graph library, and decided to try NetworkX. Here is a simple example program using it. These are mostly just notes for myself – but I am posting it here in case it is useful to anyone else.
This code is basically the NetworkX weighted graph example, with some annotations. Here is some code to create and plot a weighted graph.
import matplotlib.pyplot as plt
import networkx as nx

# Populate the graph...
map_graph = nx.Graph()

map_graph.add_edge('Issaquah','Bellevue', weight=0.11 )
map_graph.add_edge('Bellevue','Kirkland', weight=0.05 )
map_graph.add_edge('Bellevue','Redmond', weight=0.06 )
map_graph.add_edge('Kirkland','Redmond', weight=0.24 )
map_graph.add_edge('Bellevue','Seattle', weight=0.01 )
map_graph.add_edge('Renton','Seattle', weight=0.03 )
map_graph.add_edge('Renton','Bellevue', weight=0.48 )

# Determine the layout of points in the graph. Some other layouts that
# would work here are spring_layout, shell_layout, and random_layout
pos = nx.circular_layout( map_graph ) # Sets positions for nodes

# Put "dots" down for each node
nx.draw_networkx_nodes( map_graph, pos, node_size=700)

# Attaches Labesl to each node
nx.draw_networkx_labels( map_graph, pos, font_size=14, font_family='sans-serif')

map_edges = [(u,v) for (u, v, d) in map_graph.edges(data=True) ]

nx.draw_networkx_edges( map_graph,
                        pos,             # Spring
                        map_edges,       # List of edges
                        width=5, alpha=0.5, edge_color='b', style='dashed' )

plt.axis('off')
plt.show()
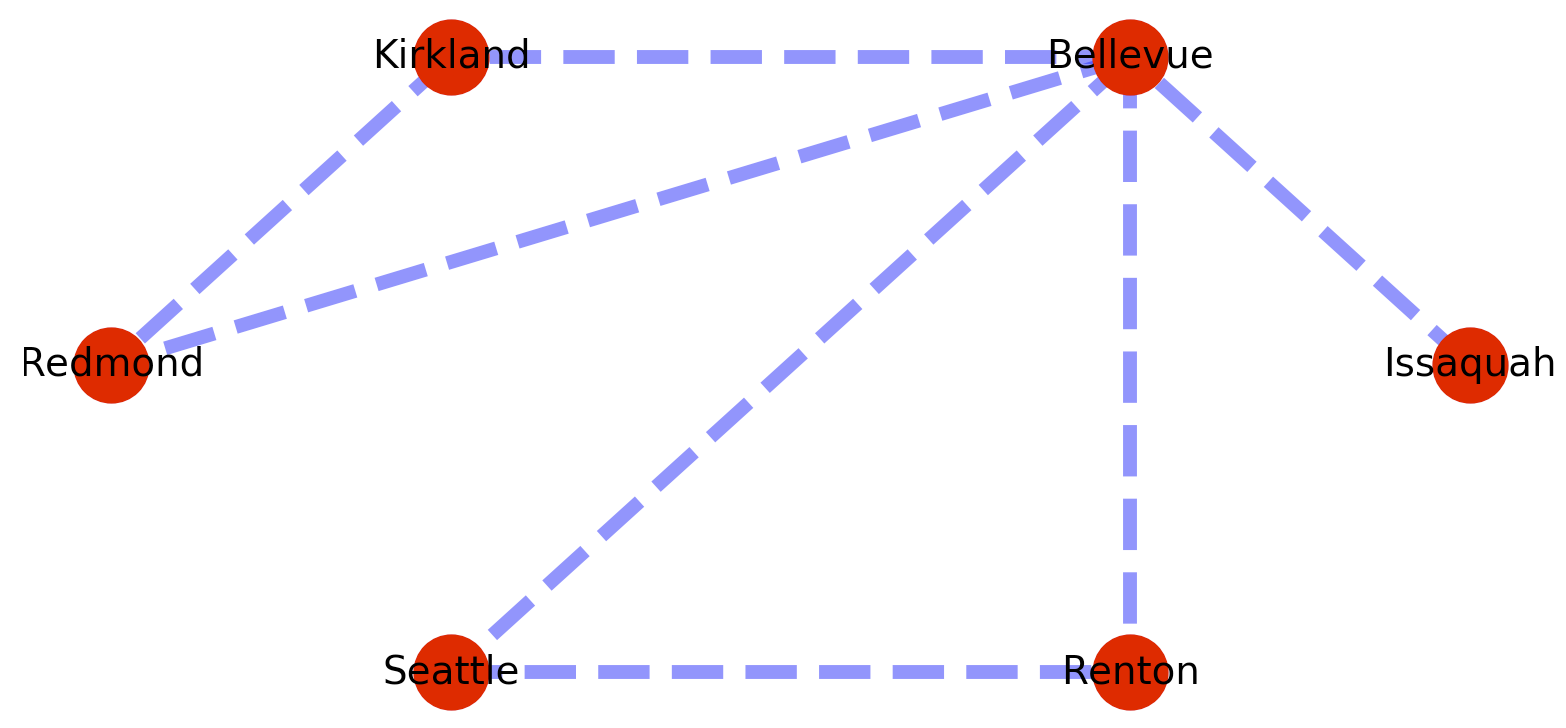
The plotted graph looks something like this.
One of the things I want from a graph library is the standard graph algorithms – like finding me the shortest path between nodes, or testing for the presence of a path at all. So for example to find the shortest path from Issaquah to Renton we could add the following code to the example above?:
# Generates the shortest path - but since there could be more than
# one of them what you get back is a "generator" from which you
# need to pluck the shortest path.
a_shortest_path = nx.all_shortest_paths(map_graph, source='Issaquah', target='Renton')

print( [p for p in a_shortest_path] )
The added code will give the path [[‘Issaquah’, ‘Bellevue’, ‘Renton’]], which is the shortest path by number of edges traversed. To obtain the shortest path by edge weight we can use dijkstras like so:
a_shortest_path = nx.dijkstra_path(map_graph, ‘Issaquah’, ‘Renton’)

print( a_shortest_path )
Which gives the path: [‘Issaquah’, ‘Bellevue’, ‘Seattle’, ‘Renton’]
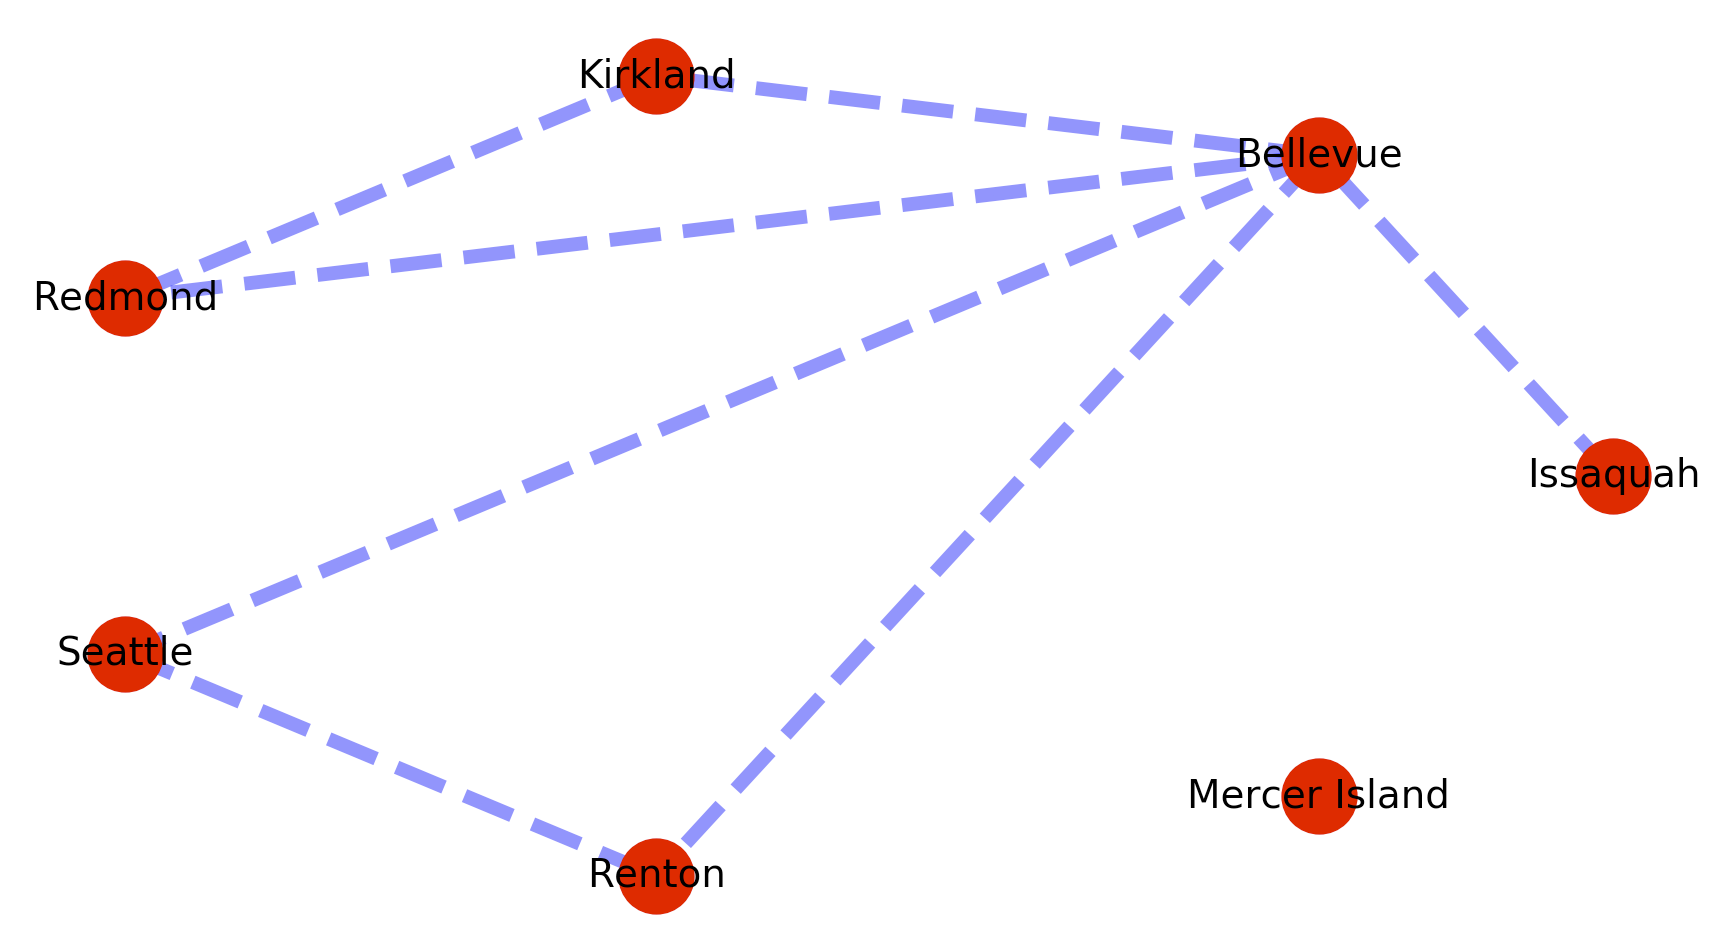
The problem is that this implementation of dijkstra’s fails when a path is not present between the origin and destination nodes. So for example if we add a disconnected vertex with no edges like below, searches on a path to that vertex will cause the call to fail.
map_graph.add_node(‘Mercer Island’)
I think you need to use the has_path method to test for the existence of any path first, then if there is a path use dijkstras to find the minimum cost path. Something like this:
# Create a helper function for testing for a path
def shortest_weighted(from_node, to_node):
    if nx.has_path( map_graph, from_node, to_node ) == True :
	a_shortest_path = nx.dijkstra_path(map_graph, from_node, to_node)
        return( a_shortest_path )
    else:
        print("No path from",from_node,"to", to_node, "\r\n")
        return( False )
Then checking for the minimum path can look something like this:
# Test where path does not exist
shortest_weighted_path = shortest_weighted( 'Issaquah', 'Mercer Island' )
if shortest_weighted_path != False:
    print( shortest_weighted_path )

# Test where path does exist
shortest_weighted_path = shortest_weighted( 'Issaquah', 'Renton' )
if shortest_weighted_path != False:
    print( shortest_weighted_path )
Neither call will fail and checking for the existing path from Issaquah to Renton will return: [‘Issaquah’, ‘Bellevue’, ‘Seattle’, ‘Renton’]
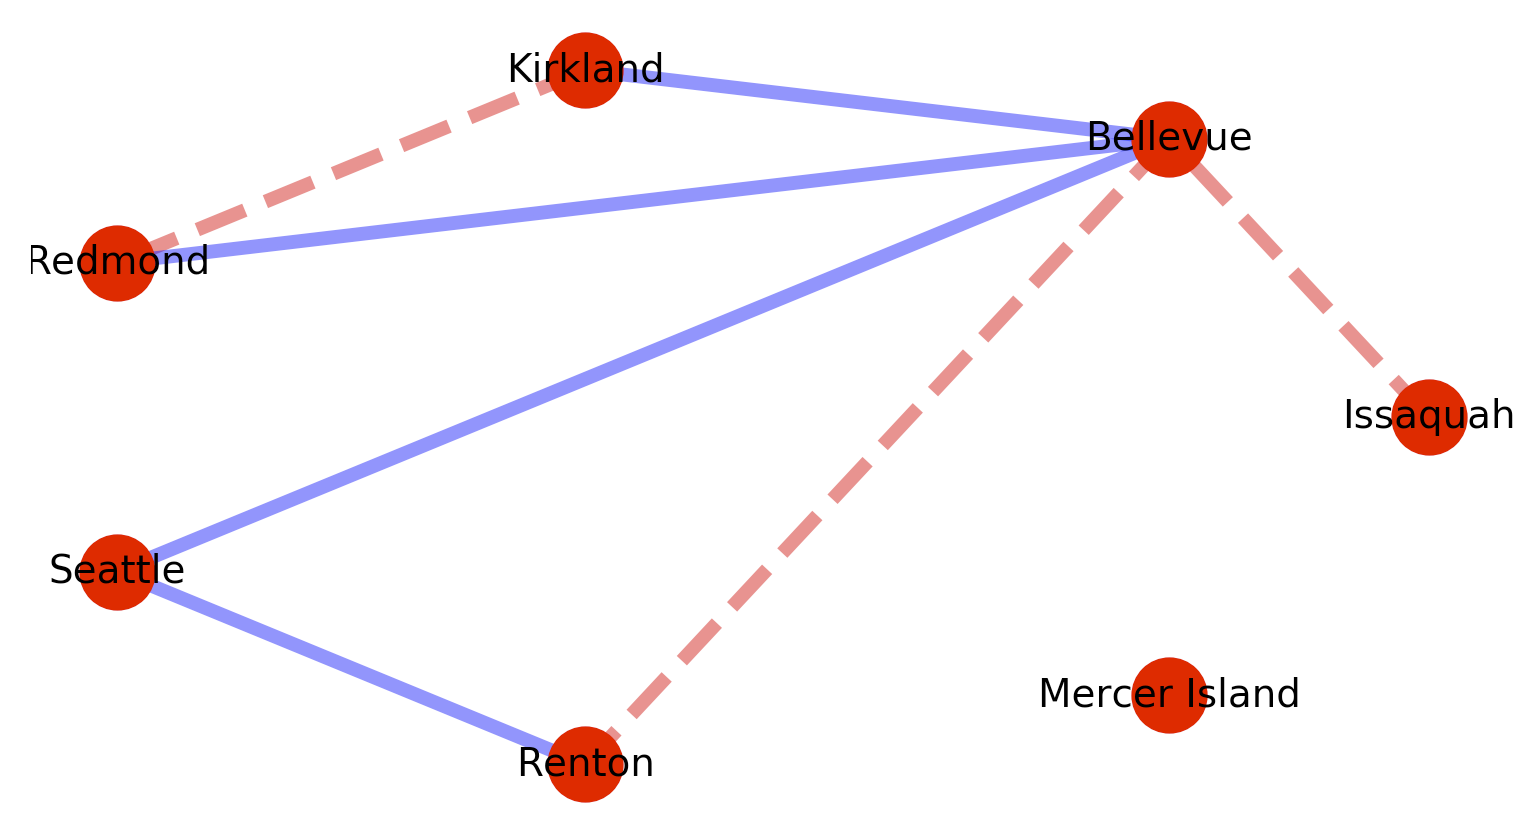
Since the graphs are weighted – list comprehensions can be used to conditionally act based on edge weights. For example:
# Segment the nodes by weight
map_red_edges  = [(u,v) for (u, v, d) in map_graph.edges(data=True) if d['weight'] >  0.1  ]
map_blue_edges = [(u,v) for (u, v, d) in map_graph.edges(data=True) if d['weight'] <= 0.1  ]
Then use the segmentation to perform multiple colorings.
nx.draw_networkx_edges( map_graph,
                        pos,             # Spring
                        map_red_edges,   # List of edges
                        width=5,
                        alpha=0.5,
                        edge_color='r',
                        style='dashed' )

nx.draw_networkx_edges( map_graph,
                        pos,             # Spring
                        map_blue_edges,  # List of edges
                        width=5,
                        alpha=0.5,
                        edge_color='b',
                        style='solid' )
Which will produce the following graph:
Also useful is shortest_path, which returns all the paths between all nodes, but sorted by vertex traversal path length. So the following code:
paths = nx.shortest_path(map_graph)
print( paths )
Generates the following paths.
{'Issaquah': {'Issaquah': ['Issaquah'], 'Bellevue': ['Issaquah', 'Bellevue'], 'Kirkland': ['Issaquah', 'Bellevue', 'Kirkland'], 'Redmond': ['Issaquah', 'Bellevue', 'Redmond'], 'Seattle': ['Issaquah', 'Bellevue', 'Seattle'], 'Renton': ['Issaquah', 'Bellevue', 'Renton']}, 'Bellevue': {'Bellevue': ['Bellevue'], 'Issaquah': ['Bellevue', 'Issaquah'], 'Kirkland': ['Bellevue', 'Kirkland'], 'Redmond': ['Bellevue', 'Redmond'], 'Seattle': ['Bellevue', 'Seattle'], 'Renton': ['Bellevue', 'Renton']}, 'Kirkland': {'Kirkland': ['Kirkland'], 'Bellevue': ['Kirkland', 'Bellevue'], 'Redmond': ['Kirkland', 'Redmond'], 'Issaquah': ['Kirkland', 'Bellevue', 'Issaquah'], 'Seattle': ['Kirkland', 'Bellevue', 'Seattle'], 'Renton': ['Kirkland', 'Bellevue', 'Renton']}, 'Redmond': {'Redmond': ['Redmond'], 'Bellevue': ['Redmond', 'Bellevue'], 'Kirkland': ['Redmond', 'Kirkland'], 'Issaquah': ['Redmond', 'Bellevue', 'Issaquah'], 'Seattle': ['Redmond', 'Bellevue', 'Seattle'], 'Renton': ['Redmond', 'Bellevue', 'Renton']}, 'Seattle': {'Seattle': ['Seattle'], 'Bellevue': ['Seattle', 'Bellevue'], 'Renton': ['Seattle', 'Renton'], 'Issaquah': ['Seattle', 'Bellevue', 'Issaquah'], 'Kirkland': ['Seattle', 'Bellevue', 'Kirkland'], 'Redmond': ['Seattle', 'Bellevue', 'Redmond']}, 'Renton': {'Renton': ['Renton'], 'Seattle': ['Renton', 'Seattle'], 'Bellevue': ['Renton', 'Bellevue'], 'Issaquah': ['Renton', 'Bellevue', 'Issaquah'], 'Kirkland': ['Renton', 'Bellevue', 'Kirkland'], 'Redmond': ['Renton', 'Bellevue', 'Redmond']}, 'Mercer Island': {'Mercer Island': ['Mercer Island']}}


